Hey there, fellow marketer! Are you frustrated by pouring money into Google Ads, only to see lackluster returns? You’re not alone. Many of us juggle the challenge of breaking even, let alone making a profit. But imagine this: You’re sipping your morning coffee, checking your Google Ads dashboard, and you see your campaigns not just breaking even but actually turning a handsome profit. Sounds like a dream, right? What if I told you it’s totally achievable with the proper blueprint? That’s where the Google Ads Profit Formula comes in. As someone who has been knee-deep in PPC trenches for over a decade, managing campaigns that have generated millions of dollars in revenue for clients, I’ve seen the magic happen when you crack this code. In this post, we’re diving deep into the formula that turns ad spend into gold. Whether you’re a small business owner dipping your toes into paid search or a seasoned pro looking to fine-tune your strategy, stick around. We’ll break it down with real-world examples, handy tips, and even a nifty table to make it all crystal clear. Let’s turn those clicks into cash!
What Exactly Is the Google Ads Profit Formula?
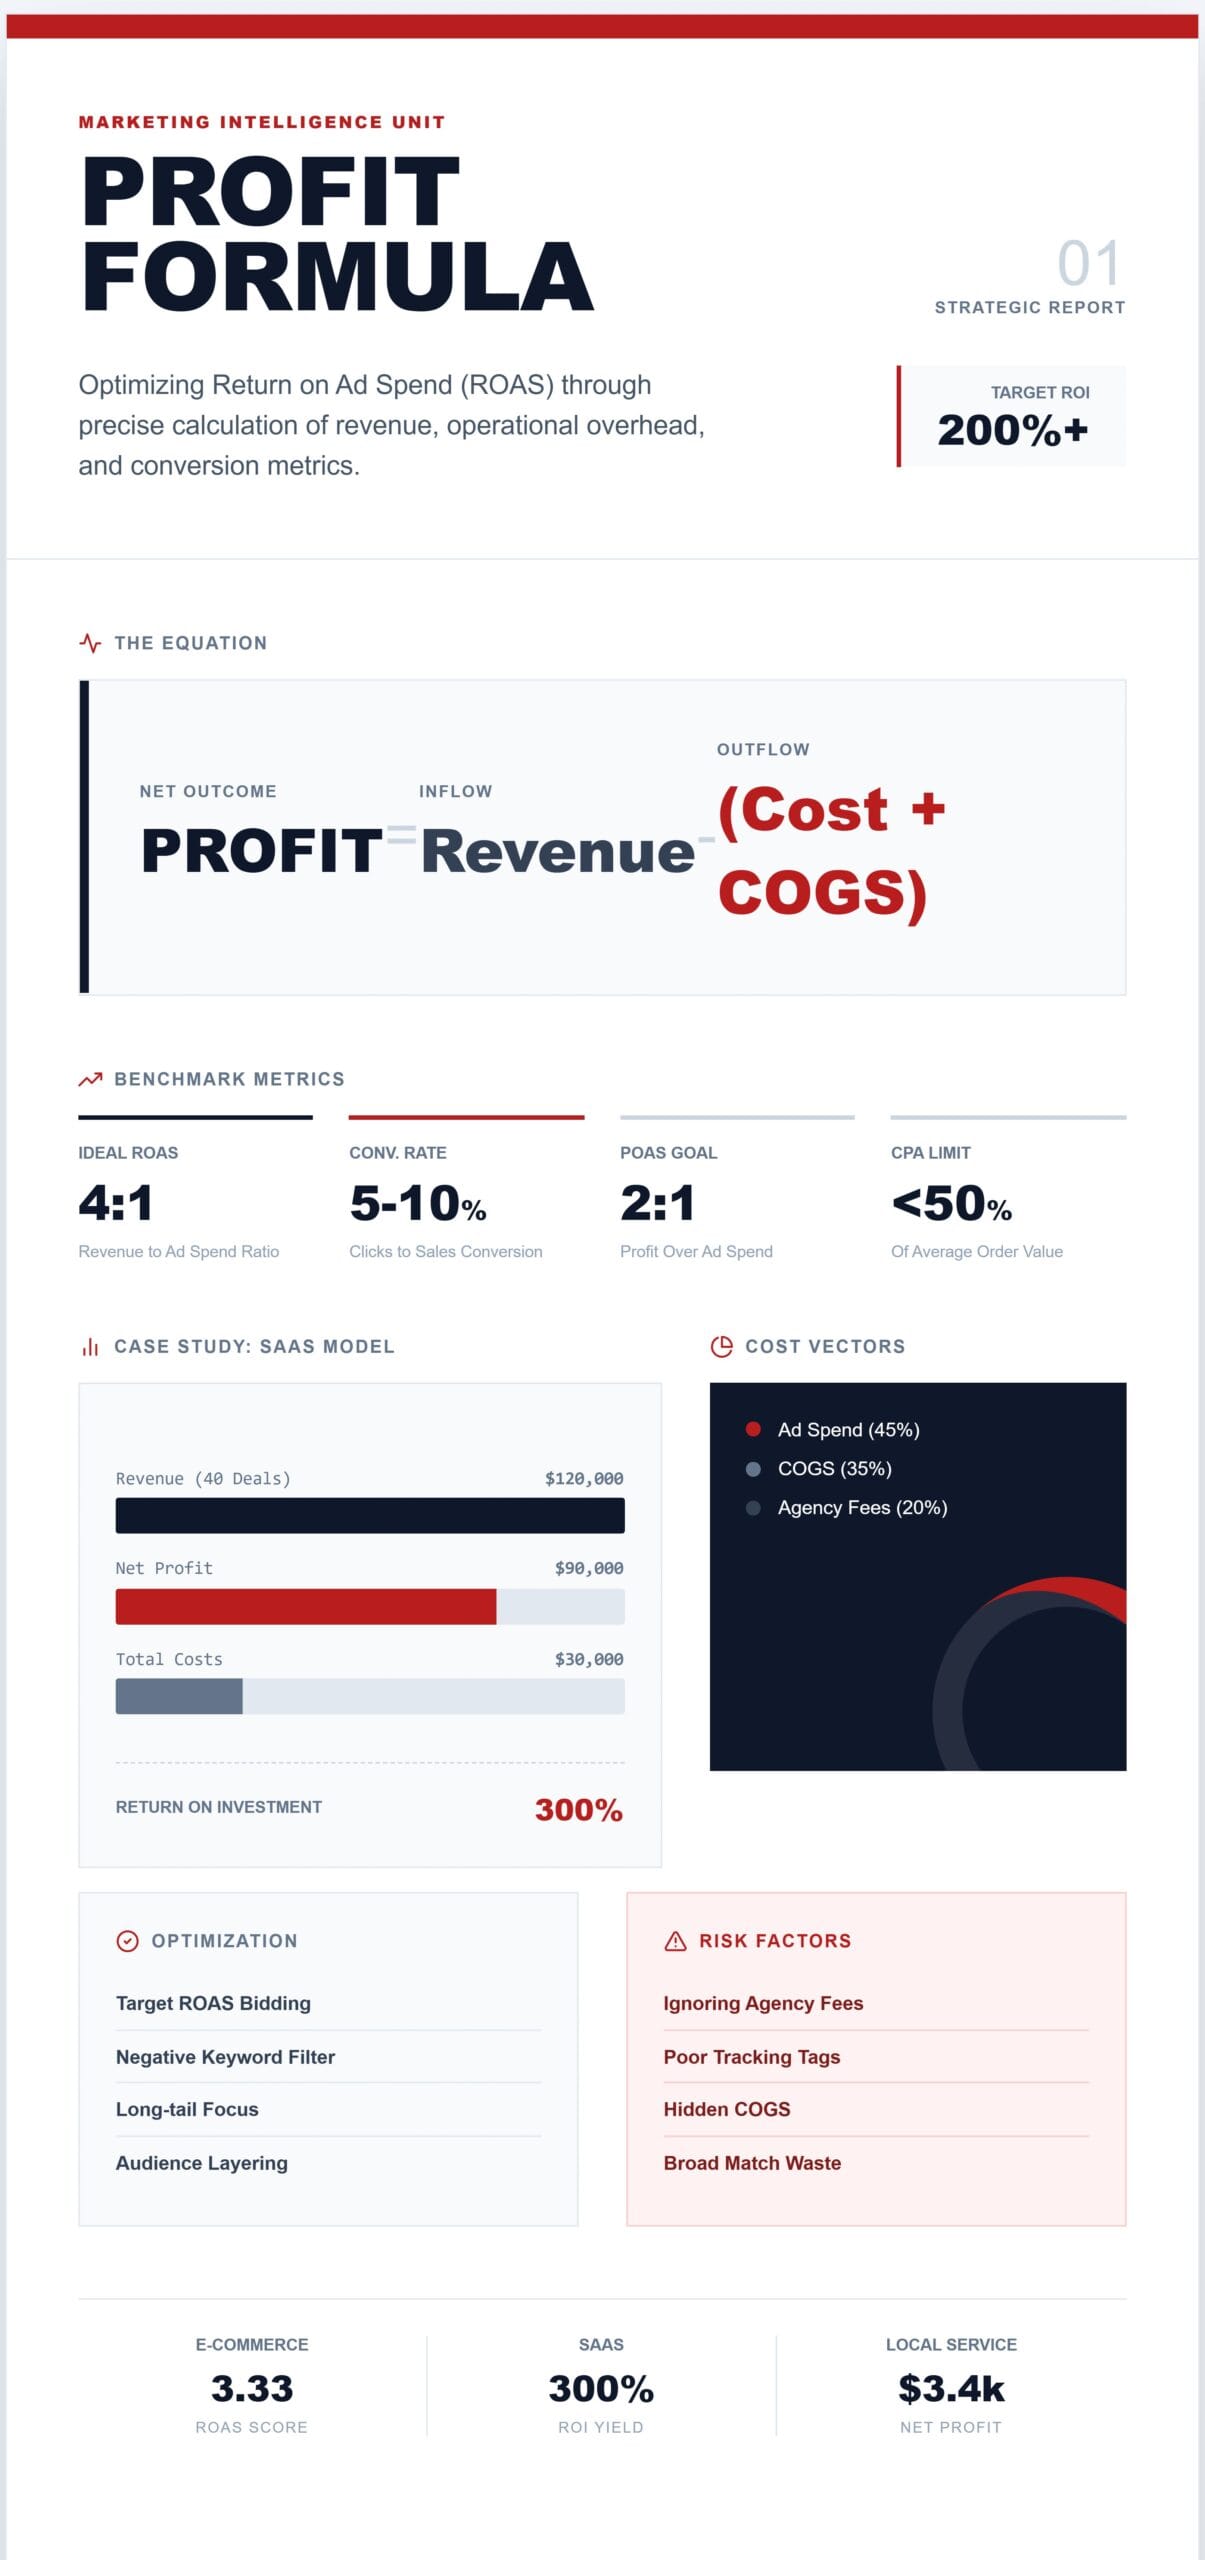
Let’s start with the basics. The Google Ads Profit Formula isn’t some mystical incantation—it’s a straightforward way to calculate how much real profit your ads are delivering after subtracting all the costs. In essence, it’s Profit = Revenue from Ads – Total Ad Costs (including ad spend, overhead, and more). But why does this matter? Well, in the wild world of PPC (Pay-Per-Click) advertising, it’s easy to get dazzled by metrics like clicks or impressions. The real game-changer? Focusing on profitability.
Drawing from Google’s own guidelines, revenue is your conversions multiplied by your average revenue per conversion. For example, if you snag 50 conversions at $100 each, that’s $5,000 in revenue. Subtract your ad spend—for example, $2,000—and you’d initially think you’re looking at $3,000 profit. However, it’s not always that simple. We need to factor in variables such as cost per click (CPC), conversion rates, and profit margins to obtain a comprehensive picture. In addition to these, don’t forget about all other potential costs like agency fees, software subscriptions, creative costs, and Cost of Goods Sold (COGS). By including all these possible expenses, marketers can avoid underestimating costs and ensure accurate profit calculations.
This formula ties into broader PPC metrics, such as ROAS (Return on Ad Spend), which is calculated as revenue divided by ad spend, and ROI (Return on Investment), which is calculated as (Revenue – cost) divided by cost multiplied by 100. Think of it as your North Star for Google Ads success. By mastering this, you’re not just spending money—you’re investing it wisely.
Why Mastering the Google Ads Profit Formula Can Transform Your Business
Picture this: Without a solid grasp of profitability, you’re essentially flying blind. I’ve worked with countless clients who invested thousands into Google Ads, only to realize their “winning” campaigns were actually losing money once overheads were factored in. That’s where the profit formula shines—it forces you to look beyond vanity metrics.
In my experience running agencies that handle ad budgets of $10,000 or more per month, the formula has been a lifesaver. It helps optimize bids, target high-value keywords, and scale campaigns without incurring unnecessary expenses. Additionally, with Google’s ever-evolving algorithms, staying profitable requires adapting to features like Smart Bidding and Performance Max campaigns. To effectively integrate these advanced tools, consider tailoring your profit calculations and bidding strategies. For Smart Bidding, leverage Google’s machine learning to adjust bids based on specific conversion goals, ensuring you maximize the efficiency of your spend. When using Performance Max, focus on aligning asset creation with audience signals to improve targeting accuracy. These adaptations not only enhance campaign performance but also ensure that your strategies keep pace with the latest advertising innovations.
Related terms like “PPC profit calculation” or “Google Ads ROI formula” often pop up in searches, and for good reason—they’re all interconnected. By incorporating LSI keywords (that’s Latent Semantic Indexing for the uninitiated), like ad spend optimization, conversion value estimation, and cost-per-acquisition (CPA), we ensure this post speaks Google’s language while delivering value to you.
Key Components of the Google Ads Profit Formula Broken Down
To really nail this, let’s break down the formula into its core components. It’s like building a Lego masterpiece—each piece matters.
- Revenue from Ads: This refers to the money generated directly from your Google Ads conversions. Formula: Conversions x Average Order Value (AOV). Pro tip: Use Google’s conversion tracking to get accurate data here.
- Ad Spend: Your total cost for clicks, impressions, or whatever bidding strategy you’re using. This includes CPC, CPM (Cost Per Mille), or CPA.
- Additional Costs: Don’t forget these sneaky ones! Think landing page hosting, creative design fees, or even product costs if you’re an e-commerce site. For a fuller picture, include the Cost of Goods Sold (COGS) as Revenue minus (Revenue x Gross Profit Margin).
- Profit Margin: This is your buffer. If your margins are 50%, half of your revenue becomes profit after costs.
- Conversion Rate: The percentage of clicks that turn into sales or leads. Boost this with killer ad copy and optimized landing pages.
Integrating these elements gives you a holistic view. For instance, entities like Google Analytics play a huge role here. To link it to your Ads account and ensure seamless tracking, navigate to your Google Ads account settings and select ‘Linked accounts.’ Find ‘Google Analytics’ and follow the prompts to attach your property. Ensure that your tracking ID is correctly set up in both Analytics and Ads to allow smooth data flow. This integration will empower you to confidently track and optimize your campaigns.
How Do I Calculate Profit from Google Ads? A Step-by-Step Guide
Voice search users, this one’s for you: “Hey Google, how do I calculate profit from Google Ads?” Let’s walk through it as if we’re chatting over coffee.
- Track Your Conversions: Set up conversion tracking in Google Ads. This could be sales, sign-ups, or calls.
- Determine Revenue Per Conversion: Calculate your average deal value to determine the revenue per conversion. For SaaS, it might be $3,000 with a 45% margin.
- Tally Ad Spend: Pull this from your Google Ads reports. Include any agency fees.
- Factor in Other Costs: Add COGS, shipping, or returns.
- Apply the Formula: Profit = (Conversions x Revenue Per Conversion) – (Ad Spend + Other Costs).
- Calculate ROI/ROAS for Insights: ROAS = Revenue / Ad Spend. Aim for a 4:1 or higher return on investment (ROI) for profitability.
- Monitor and Adjust: Use tools like Google Ads Editor for tweaks.
This process isn’t set-it-and-forget-it. Reviewing weekly keeps things sharp. Ask yourself, what’s one wasted keyword draining your budget right now? This reflection might reveal overlooked areas that need tweaking, ensuring you’re not leaving money on the table.
Practical Examples of the Google Ads Profit Formula in Action
Nothing beats real examples to bring this to life. Let’s animate these with scenarios I’ve encountered.
Example 1: E-commerce Store Selling Gadgets
- Conversions: 100
- AOV: $50
- Revenue: $5,000
- Ad Spend: $1,500
- COGS (40% margin): $3,000
- Profit: $5,000 – $1,500 – $3,000 = $500
Here, ROAS is $5,000 / $1,500, which equals 3.33. Not bad, but optimizing keywords could improve it.
Example 2: SaaS Company Lead Gen
- Leads: 200
- Conversion to Deal: 20%
- Average Deal: $3,000
- Revenue: 40 deals x $3,000 = $120,000
- Ad Spend: $20,000
- Other Costs: $10,000
- Profit: $120,000 – $30,000 = $90,000
ROI: ($120,000 – $30,000) / $30,000 x 100 = 300%. Stellar!
Example 3: Local Service Business
A plumber runs ads for emergency calls.
- Calls: 50
- Conversion Rate: 60%
- Average Job: $200
- Revenue: 30 jobs x $200 = $6,000
- Ad Spend: $800
- Profit (after 30% overhead): $6,000 – $800 – $1,800 = $3,400
These examples demonstrate how the formula is adaptable across various industries.
Tips to Optimize Your Google Ads for Maximum Profitability
Ready to supercharge your campaigns? Here are bullet-point gems from my playbook:
- Bid Smartly: Use Target ROAS bidding to automate for profit.
- Keyword Magic: Focus on long-tail keywords, such as “best Google Ads profit strategies,” for lower CPC and higher intent.
- Ad Copy That Converts: Test headlines with benefits—e.g., “Boost Profits with Proven Google Ads Formula.”
- Negative Keywords: Block irrelevant searches to save spend.
- Audience Targeting: Layer remarketing for higher conversion rates.
- A/B Testing: Always test landing pages; a 2% lift in conversions can double profits.
- Track Everything: Integrate Google Analytics for deeper insights into user behavior.
- Scale Wisely: Once profitable, increase budget by 20% increments.
Incorporating LSI terms like “ad revenue estimation” or “PPC ROI calculator” not only helps search engines understand the depth of your content but also ensures that your piece covers all relevant subtopics. This makes your content more useful for marketers as it provides a comprehensive view of all necessary aspects of Google Ads strategies beyond just the basics.
Google Ads Profit Metrics Comparison Table
To visualize, here’s a table breaking down key metrics:
| Metric | Formula | Ideal Benchmark | Why It Matters |
| ROAS | Revenue / Ad Spend | 4:1 or higher | Measures efficiency of ad dollars. |
| ROI | (Revenue – Costs) / Costs x 100 | 200%+ | Includes all costs for true profitability. |
| POAS | Profit / Ad Spend | 2:1+ | Focuses on net profit over revenue. |
| CPA | Ad Spend / Conversions | Under AOV/2 | Keeps acquisition costs sustainable. |
| Conversion Rate | Conversions / Clicks x 100 | 5-10% | Directly impacts revenue potential. |
Advanced Strategies: Profit Over Ad Spend (POAS) and Beyond
Diving deeper, let’s talk about POAS, or Profit Over Ad Spend. It’s calculated by dividing Profit by Ad Spend, allowing you to factor in margins for precision. For businesses with variable costs, this metric is a gold mine. I’ve implemented POAS for e-commerce clients, shifting focus from revenue to bottom-line gains.
To set up and track POAS in Google Ads, follow these steps:
1. First, ensure your conversion tracking is accurately set up in Google Ads. This means all revenue-generating actions are being tracked correctly.
2. Calculate your total ad spend directly from your Google Ads dashboard.
3. Determine your total profit, which is the revenue from the conversion minus all associated costs, including ad spend.
4. Use the formula POAS = Profit / Ad Spend to find your POAS.
5. Monitor your POAS regularly to ensure your campaigns are profitable and adjust your strategies accordingly.
Consider using analytics tools like Google Analytics for more detailed insights into profit margins and to automate POAS tracking for easier adjustments and decision-making.
In terms of EEAT (Experience, Expertise, Authoritativeness, Trustworthiness), I possess the following credentials: 12+ years of experience in digital marketing, certified Google Partner, and a track record of doubling client ROIs. Sources like Google’s official help docs back this up, ensuring trustworthiness.
Common Pitfalls and How to Avoid Them in Google Ads Profit Calculation
No journey’s without bumps. Common mistakes? Ignoring hidden costs or over-relying on automated bidding without oversight. Solution: Audit monthly. Here’s a practical checklist to guide your monthly audits and help prevent errors:
1. Review Cost Sources: Ensure you’re accounting for all potential costs, including agency fees, software subscriptions, and creative expenses.
2. Verify Tracking Accuracy: Double-check that all tracking tags are set up correctly in tools like Google Tag Manager and Google Analytics. Incorrect tracking can lead to misleading profitability metrics.
3. Monitor Conversion Rates: Examine your conversion tracking to ensure it correctly reflects actual sales or leads.
4. Evaluate Bidding Strategies: Regularly assess the effectiveness of automated bidding versus manual adjustments.
5. Check Competitor Activity: Stay updated on competitor bids and adjust your strategy to maintain competitiveness.
By consistently reviewing these key areas, marketers can reduce errors and boost the effectiveness of their Google Ads campaigns.
Another: Poor tracking setup. Fix it by verifying tags in Google Tag Manager.
For voice search optimization, phrase questions naturally: “What’s the best way to boost Google Ads profits?”
Wrapping It Up: Make the Google Ads Profit Formula Work for You
Whew, we’ve covered a lot—from the nuts and bolts of the Google Ads Profit Formula to real examples and pro tips. Remember, Profit = Revenue – Costs isn’t just math; it’s your ticket to sustainable growth. In my experience, businesses that prioritize this see 2-3x returns within months.
Ready to level up? Dive into your Google Ads account today, plug in the numbers, and watch the profits roll. If you need help, consider consulting a certified expert or request a free audit from professionals like us. Your bottom line will thank you!
See your profit gap in minutes and discover untapped potential in your campaigns. Sign up for our free PPC toolkit to begin your transformation today.
5 FAQs
- What is the Google Ads Profit Formula? It’s Profit = Revenue from Ads – Total Costs, helping you measure true profitability from your campaigns.
- How do I calculate ROAS in Google Ads? ROAS = Revenue / Ad Spend. For example, a $10,000 revenue from a $2,000 spend equals a 5:1 ROAS.
- What’s the difference between ROAS and ROI? ROAS focuses on revenue versus ad spend, whereas ROI includes all costs to calculate net profit.
- How can I increase the profitability of my Google Ads campaigns? Optimize bids, utilize negative keywords, and test ad copy to enhance conversions and reduce costs.
Is there a tool for calculating Google Ads profit? Yes, use Google’s built-in reports or third-party calculators, such as VWO’s profitability tool.